You may have wondered why the sign in the yard down the street has been there longer than others nearby were six months ago. Are we in for trouble? After several years of above average appreciation and lower than average inventory there are signs that the market is stabilizing a little. These two graphs from Mike Malec have great information.
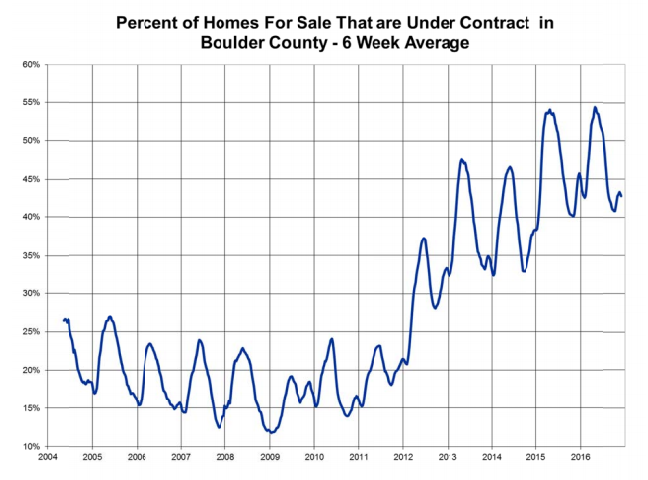
This first graph looks at the 6 week average for the percent of homes for sale that are under contract. A stable market is 25-40% under contract. A seller’s market is above 40% and a buyer’s market is below 25%. Since 2013 the numbers really have fallen in a seller’s market. Currently homes are taking just a touch longer to go under contract than a few months ago. Perhaps a sign that things are softening? You typically have more than a few hours to decide if the home you just saw is the one for you. Take a deep breath!
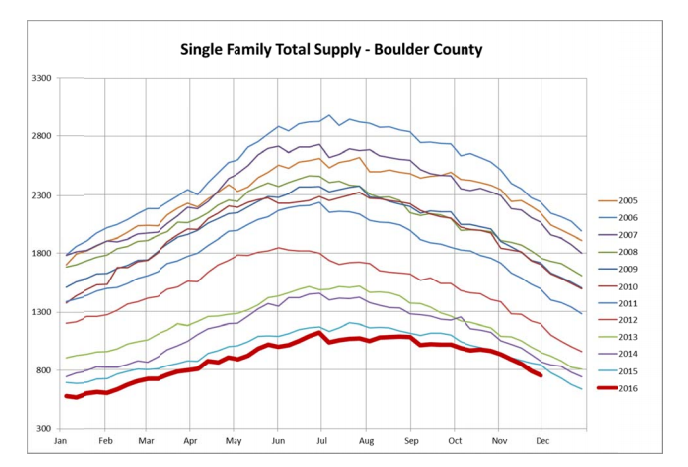
The graph below shows that inventory is still historically low. Can it get any lower? It appears that inventory is stabilizing and will perhaps increase. That will decrease the pressure on prices. Classic supply and demand. 
Even with some signs that our current cycle of rapid appreciation is coming to an end it still looks like we will see positive price appreciation, just not at the rates we’ve seen over the last 3 years. Interest rates appear to be headed up and prices will continue to increase so it’s a great time to get out and buy a home before the circumstances are not as favorable.
Let me know what you’re looking for and I’ll help you every step of the way, into that new home. Happy house hunting.

