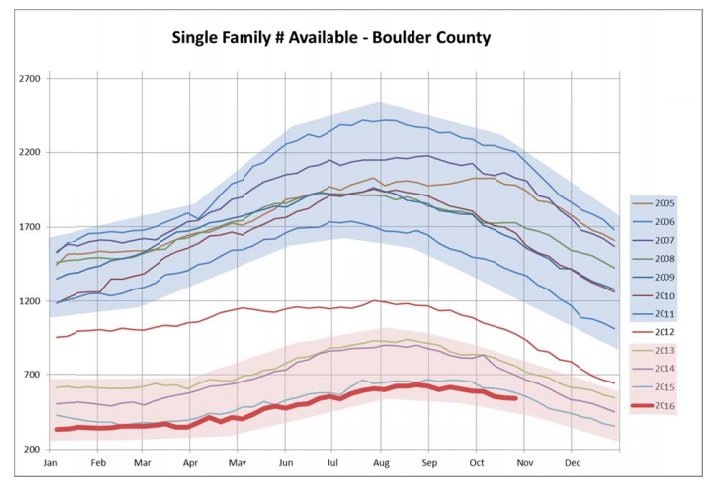
Since the Cubs just made history I thought it would be a good time to go back in time here in Boulder County. We’ve continued to see a lower number of available homes (as compared to the previous “norm”). Even though we’re currently seeing inventory build ever so slightly, properties are being snatched up and prices are on the rise (between 9% and 15% for our Boulder County cities).
Check out the graph below put out by the Boulder Realtor Association. The shaded blue area indicates our typical inventory (for years 2005-2012). The shaded red area is what we’ve been experiencing over the last three years (2013-2016). The question is, will we get back into the blue area in the next year or two or will we remain in the red? I’m hoping we can find somewhere closer in the middle to settle into in the no too distant future. 2017 will be an interesting year!

