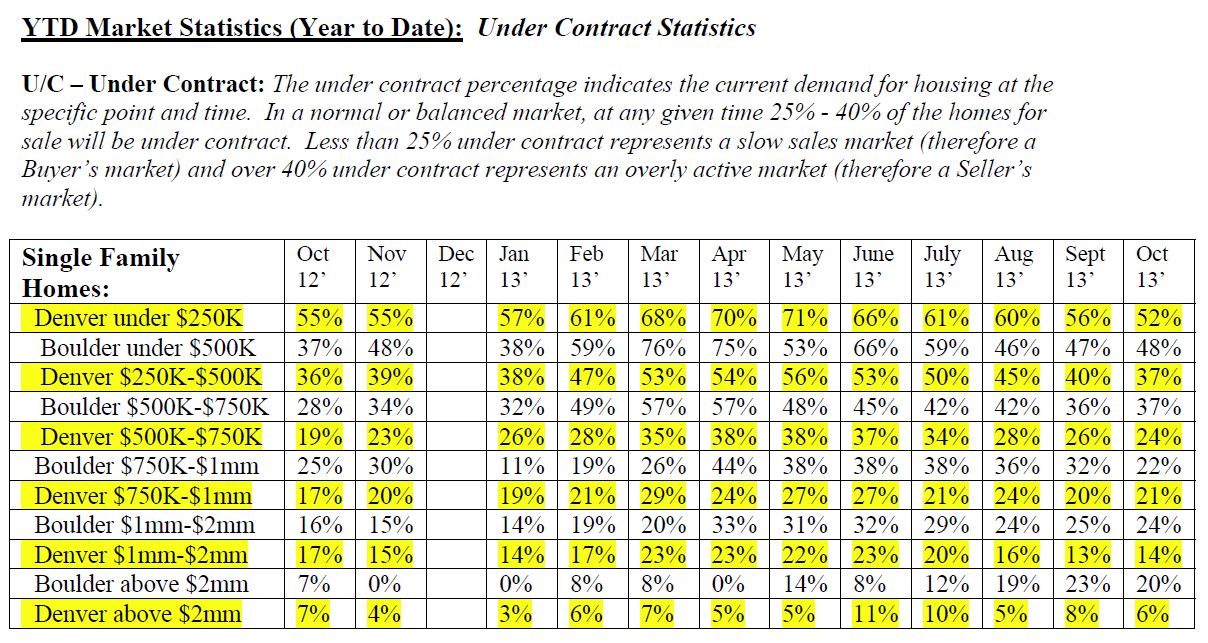
Fall (or winter today) is in the air and it’s a good time to stop and see what’s going on in our local market. The under contract statistics are a great indicator of where the market has been and where it is going. You’ll see across the board that the number of homes under contract is slowly decreasing. We peaked in April and May and have seen some of our market return to a more balanced market. Buyers have a little more time to think about a home, but homes that are priced well and show well are still going very quickly. We’re heading towards our historically low inventory months (December and January).
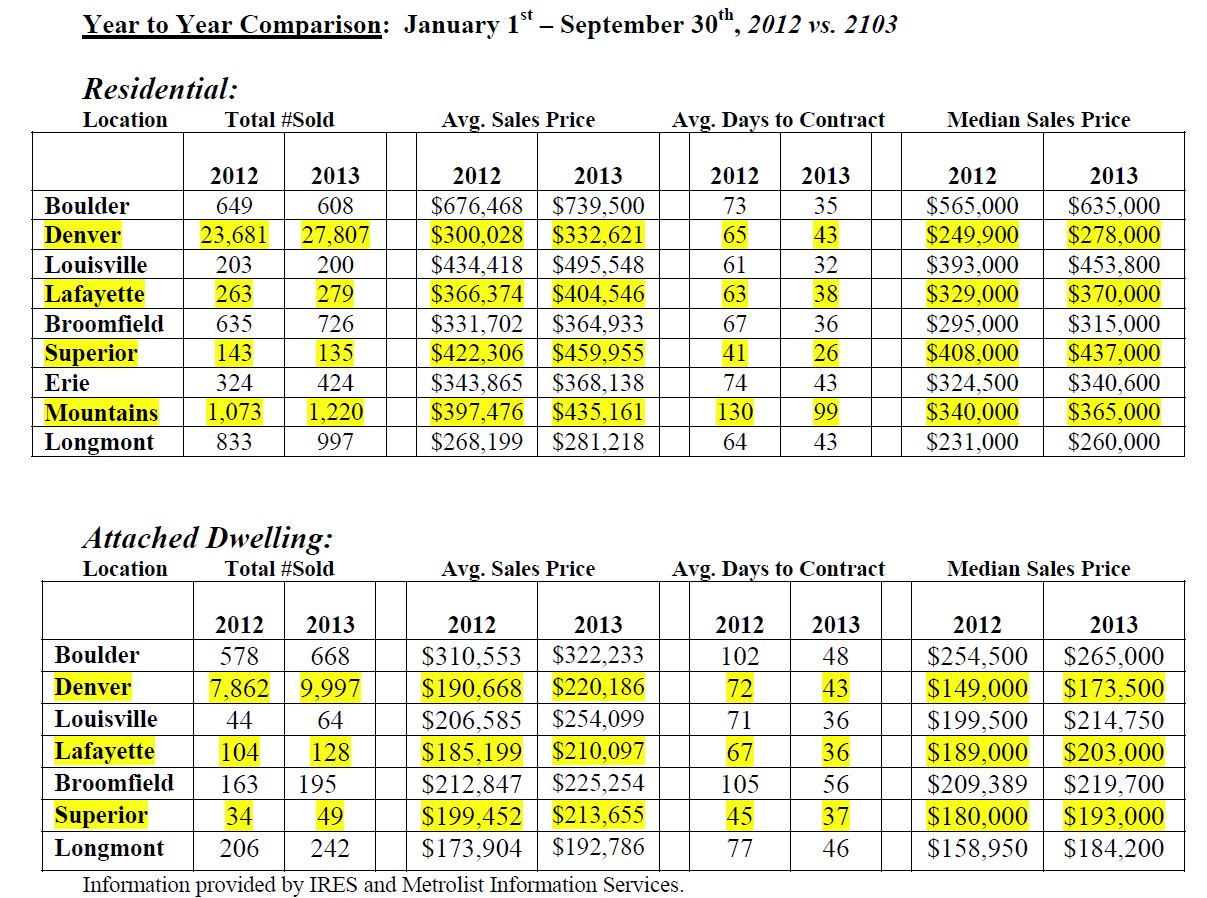
I’ve also include a YTD comparison for homes and condos for # sold, sales price and days to contract. Prices have definitely seen an increase. In some cases quite significant. You will see that in some areas the number of homes sold is under the low levels of 2012. It has been an interesting year. Time will tell how the flood of 2013 will affect sales here in our area.


